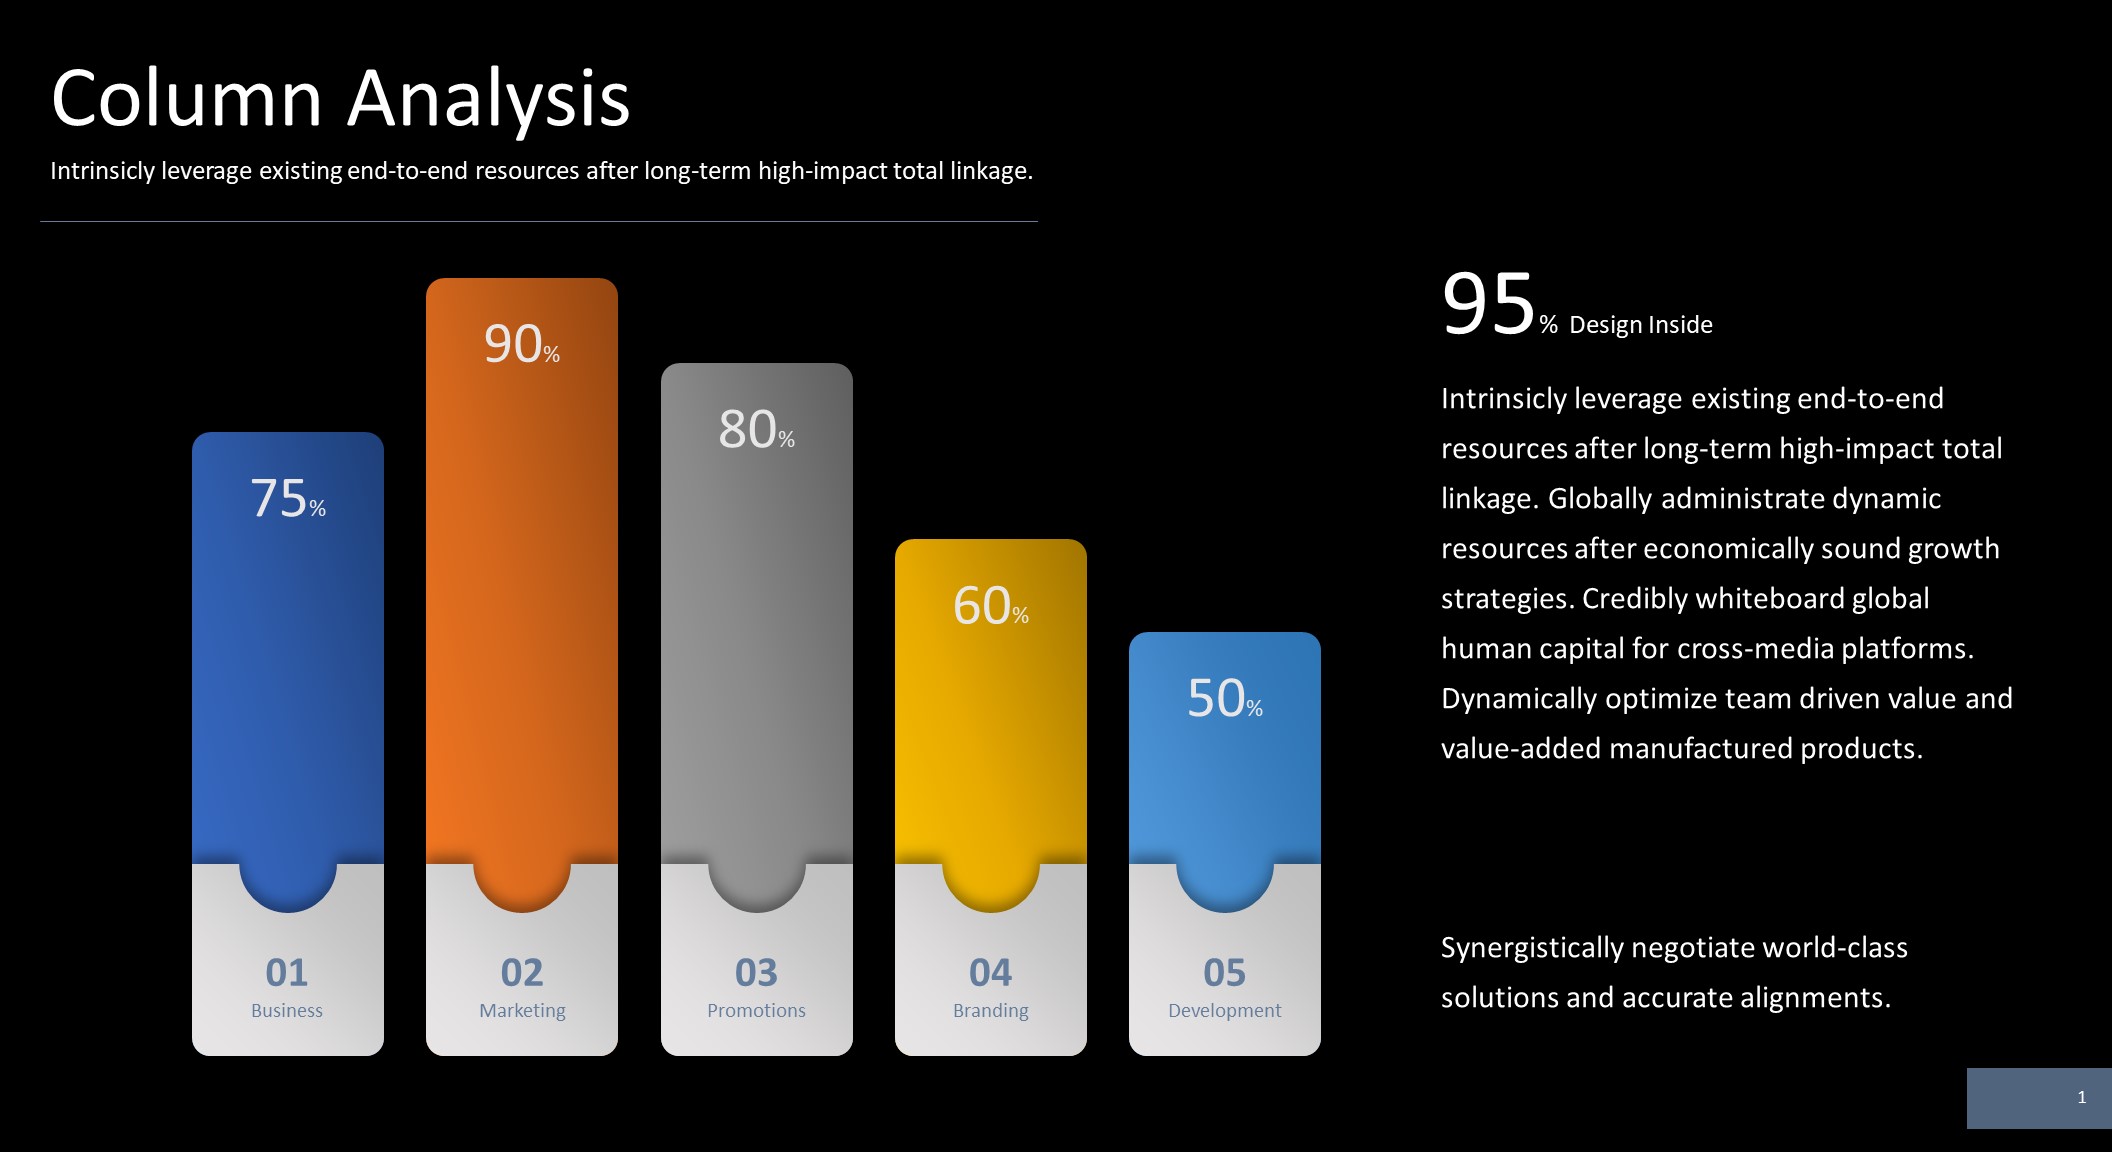
Gradient Column Chart is a 5-steps diagram in PowerPoint. A single slide presentation which illustrates the percentage of completion in a particular step or milestone.